AKJPプロンプト

Mathematical.jp BU/repo


Rでggplot2によるグラフ描画


RstudioでSIRモデル描画

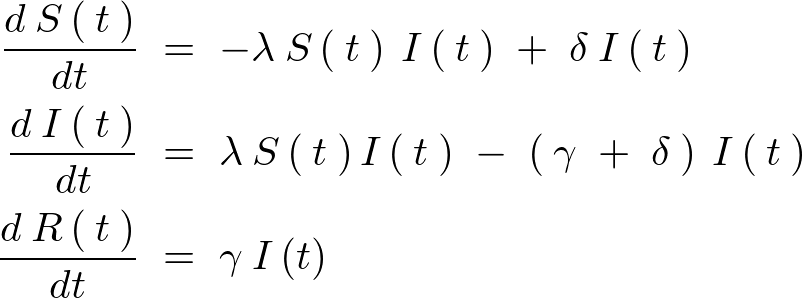
以下に示すケルマックマッケンドリック微分方程式

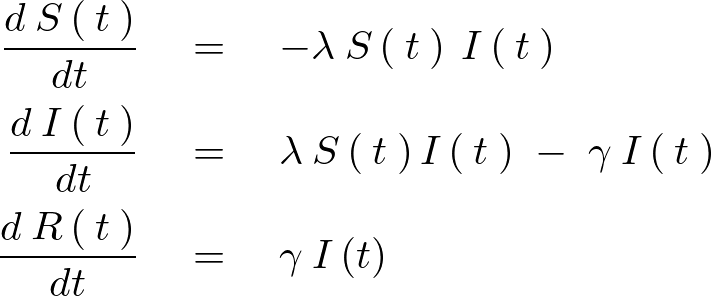
この上記一連の微分方程式において免疫を獲得しないで回復する率と置いた場合の式は以下のようになります。

この変数tにおける上記常微分方程式を、ケルマックマッケンドリックのS-I-Rモデルと呼びます。

この微分方程式に関して架空の数値を代入していったものをRのパッケージのdeSolveを使って解いていきそれらをRのパッケージ“ggplot2”を使って実際にこの微分方程式の動きを描画してみましょう。

deSolveの読み込み

Rを立ち上げたらまずlibrary(deSolve)と打ち込んで読み込みを行います。

Plain text
Copy to clipboard
Open code in new window
EnlighterJS 3 Syntax Highlighter
library(deSolve)
library(deSolve)
library(deSolve)

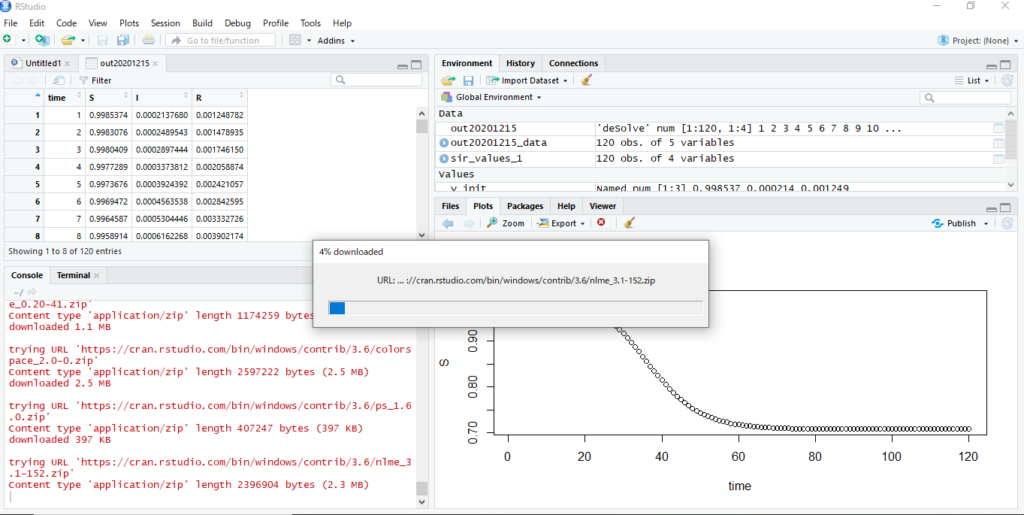
deSolveのライブラリ読み込みを行うと“ode”というのが使えるようになり結果が以下のように出てきます。

time S I R

1

0.998537432 0.000213768 0.001248782

2

0.998307644

0.000248954

0.001478935

3

0.998040915

0.0002897444

0.001746150

120

0.707915532

5.38E-07

0.345215539

得られたデータを新たにout20201215_dataへ格納し結果を表示させます。

Plain text
Copy to clipboard
Open code in new window
EnlighterJS 3 Syntax Highlighter
out20201215_data <- as.data.frame(out20201215_data)
Plain text
Copy to clipboard
Open code in new window
EnlighterJS 3 Syntax Highlighter
out20201215_data <- as.data.frame(out20201215_data)
out20201215_data
X time S I R
1 1 1 0.9985374 2.137680e-04 0.001248782
2 2 2 0.9983076 2.489543e-04 0.001478935
3 3 3 0.9980409 2.897444e-04 0.001746150
4 4 4 0.9977289 3.373812e-04 0.002058874
5 5 5 0.9973676 3.924392e-04 0.002421057
6 6 6 0.9969472 4.563538e-04 0.002842595
7 7 7 0.9964587 5.304446e-04 0.003332726
8 8 8 0.9958914 6.162268e-04 0.003902174
9 9 9 0.9952331 7.154392e-04 0.004563457
10 10 10 0.9944695 8.300421e-04 0.005330965
   ・・・(中略)・・・
110 110 110 0.7079237 2.118373e-06 0.345204052
111 111 111 0.7079223 1.846934e-06 0.345206025
112 112 112 0.7079210 1.610274e-06 0.345207745
113 113 113 0.7079200 1.403938e-06 0.345209244
114 114 114 0.7079191 1.224039e-06 0.345210551
115 115 115 0.7079183 1.067192e-06 0.345211691
116 116 116 0.7079176 9.304421e-07 0.345212685
117 117 117 0.7079169 8.112149e-07 0.345213551
118 118 118 0.7079164 7.072650e-07 0.345214306
119 119 119 0.7079159 6.166351e-07 0.345214965
120 120 120 0.7079155 5.376184e-07 0.345215539
out20201215_data <- as.data.frame(out20201215_data) out20201215_data X time S I R 1 1 1 0.9985374 2.137680e-04 0.001248782 2 2 2 0.9983076 2.489543e-04 0.001478935 3 3 3 0.9980409 2.897444e-04 0.001746150 4 4 4 0.9977289 3.373812e-04 0.002058874 5 5 5 0.9973676 3.924392e-04 0.002421057 6 6 6 0.9969472 4.563538e-04 0.002842595 7 7 7 0.9964587 5.304446e-04 0.003332726 8 8 8 0.9958914 6.162268e-04 0.003902174 9 9 9 0.9952331 7.154392e-04 0.004563457 10 10 10 0.9944695 8.300421e-04 0.005330965    ・・・(中略)・・・ 110 110 110 0.7079237 2.118373e-06 0.345204052 111 111 111 0.7079223 1.846934e-06 0.345206025 112 112 112 0.7079210 1.610274e-06 0.345207745 113 113 113 0.7079200 1.403938e-06 0.345209244 114 114 114 0.7079191 1.224039e-06 0.345210551 115 115 115 0.7079183 1.067192e-06 0.345211691 116 116 116 0.7079176 9.304421e-07 0.345212685 117 117 117 0.7079169 8.112149e-07 0.345213551 118 118 118 0.7079164 7.072650e-07 0.345214306 119 119 119 0.7079159 6.166351e-07 0.345214965 120 120 120 0.7079155 5.376184e-07 0.345215539
out20201215_data <- as.data.frame(out20201215_data)
out20201215_data
X time S I R
1 1 1 0.9985374 2.137680e-04 0.001248782
2 2 2 0.9983076 2.489543e-04 0.001478935
3 3 3 0.9980409 2.897444e-04 0.001746150
4 4 4 0.9977289 3.373812e-04 0.002058874
5 5 5 0.9973676 3.924392e-04 0.002421057
6 6 6 0.9969472 4.563538e-04 0.002842595
7 7 7 0.9964587 5.304446e-04 0.003332726
8 8 8 0.9958914 6.162268e-04 0.003902174
9 9 9 0.9952331 7.154392e-04 0.004563457
10 10 10 0.9944695 8.300421e-04 0.005330965

   ・・・(中略)・・・

110 110 110 0.7079237 2.118373e-06 0.345204052
111 111 111 0.7079223 1.846934e-06 0.345206025
112 112 112 0.7079210 1.610274e-06 0.345207745
113 113 113 0.7079200 1.403938e-06 0.345209244
114 114 114 0.7079191 1.224039e-06 0.345210551
115 115 115 0.7079183 1.067192e-06 0.345211691
116 116 116 0.7079176 9.304421e-07 0.345212685
117 117 117 0.7079169 8.112149e-07 0.345213551
118 118 118 0.7079164 7.072650e-07 0.345214306
119 119 119 0.7079159 6.166351e-07 0.345214965
120 120 120 0.7079155 5.376184e-07 0.345215539

得られたデータを描画

ggplot2が必要なのでインストールしていない場合は以下のようにしてインストールします。

Plain text
Copy to clipboard
Open code in new window
EnlighterJS 3 Syntax Highlighter
install.packages("tidyverse")
Plain text
Copy to clipboard
Open code in new window
EnlighterJS 3 Syntax Highlighter
install.packages("tidyverse")
package ‘lattice’ successfully unpacked and MD5 sums checked
package ‘colorspace’ successfully unpacked and MD5 sums checked
package ‘tidyr’ successfully unpacked and MD5 sums checked
package ‘xml2’ successfully unpacked and MD5 sums checked
package ‘tidyverse’ successfully unpacked and MD5 sums checked
The downloaded binary packages are in
C:\Users\○○〇\AppData\Local\Temp\RtmpkLeqvN\downloaded_packages
install.packages("tidyverse") package ‘lattice’ successfully unpacked and MD5 sums checked package ‘colorspace’ successfully unpacked and MD5 sums checked ・ ・ ・ package ‘tidyr’ successfully unpacked and MD5 sums checked package ‘xml2’ successfully unpacked and MD5 sums checked package ‘tidyverse’ successfully unpacked and MD5 sums checked The downloaded binary packages are in C:\Users\○○〇\AppData\Local\Temp\RtmpkLeqvN\downloaded_packages
install.packages("tidyverse")


package lattice successfully unpacked and MD5 sums checked
package colorspace successfully unpacked and MD5 sums checked


package tidyr successfully unpacked and MD5 sums checked
package xml2 successfully unpacked and MD5 sums checked
package tidyverse successfully unpacked and MD5 sums checked


The downloaded binary packages are in
C:\Users\○○〇\AppData\Local\Temp\RtmpkLeqvN\downloaded_packages

のようになったらインストールが完了になります。

このパッケージはグラフを重ねるように書いていくものになります。

ひとつひとつやっていくと何をやってるかわかりやすいのでそれぞれ順を追って描画していきましょう。
次のように入力します。

Plain text
Copy to clipboard
Open code in new window
EnlighterJS 3 Syntax Highlighter
S_plot_0 <- ggplot(data = out20201215_data, mapping = aes(x = time, y = S))

上記のS_plot_0を描画します。次のように入力します。

Plain text
Copy to clipboard
Open code in new window
EnlighterJS 3 Syntax Highlighter
S_plot_0
S_plot_0
S_plot_0

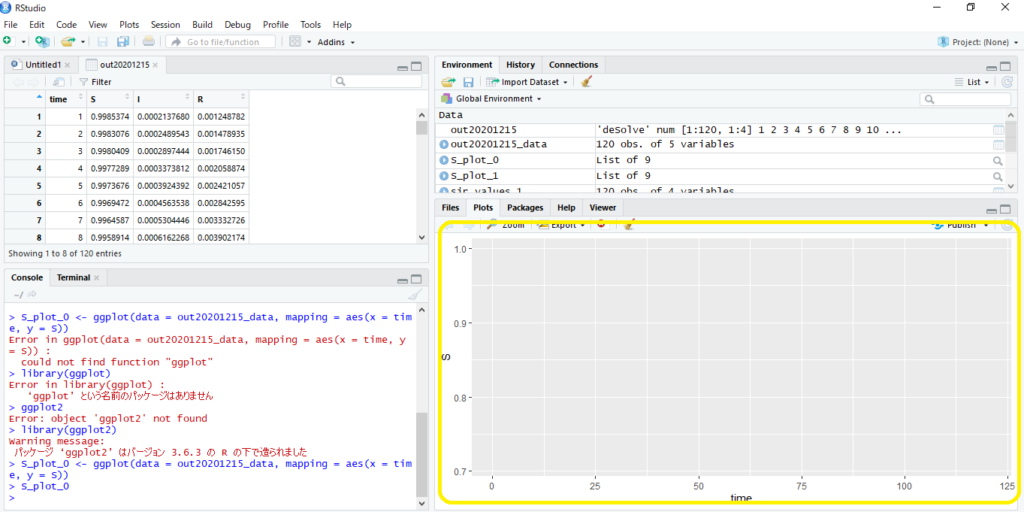
そうすると次のように下地が出来上がります。

これに導き出したデータのグラフを重ねて表示させていきます。

Sの描画

名前をS_plot_1とし次のように入力。

Plain text
Copy to clipboard
Open code in new window
EnlighterJS 3 Syntax Highlighter
S_plot_1 <- S_plot_0 + layer(geom = "line", stat = "identity", position = "identity")

描画させます。次のように入力。

Plain text
Copy to clipboard
Open code in new window
EnlighterJS 3 Syntax Highlighter
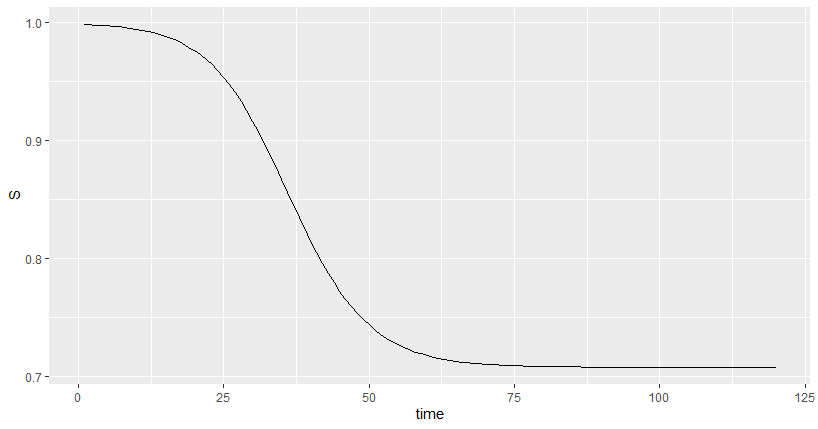
S_plot_1
S_plot_1
S_plot_1

次のように出力されます。

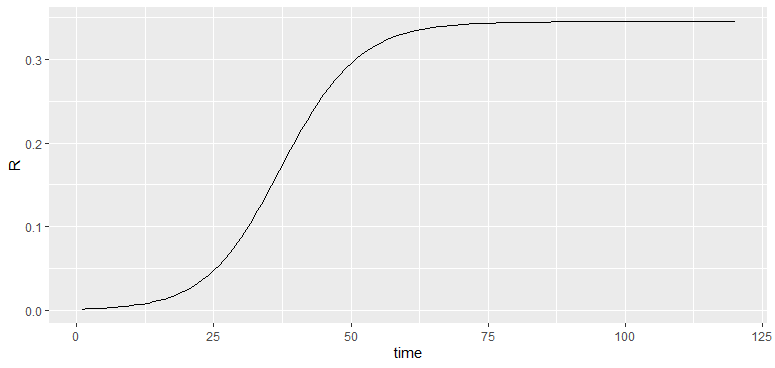
I、Rに対しても同じようにして描画していきます。

Iの描画

Plain text
Copy to clipboard
Open code in new window
EnlighterJS 3 Syntax Highlighter
I_plot_0 <- ggplot(data = out20201215_data, mapping = aes(x = time, y = I))
I_plot_1 <- I_plot_0 + layer(geom = "line", stat = "identity", position = "identity")
I_plot_1
I_plot_0 <- ggplot(data = out20201215_data, mapping = aes(x = time, y = I)) I_plot_1 <- I_plot_0 + layer(geom = "line", stat = "identity", position = "identity") I_plot_1
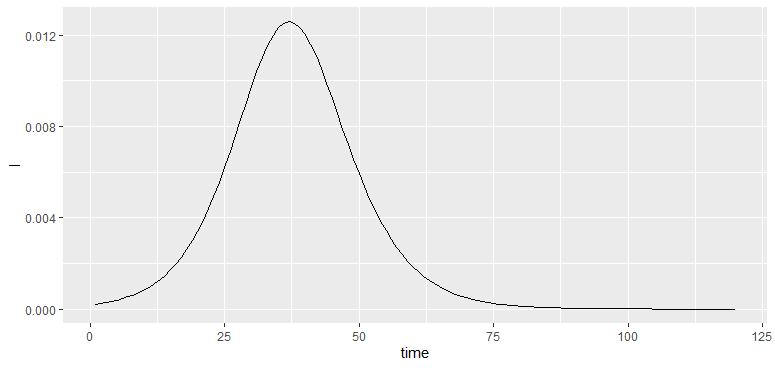
I_plot_0 <- ggplot(data = out20201215_data, mapping = aes(x = time, y = I))
I_plot_1 <- I_plot_0 + layer(geom = "line", stat = "identity", position = "identity")
I_plot_1

Rの描画

Plain text
Copy to clipboard
Open code in new window
EnlighterJS 3 Syntax Highlighter
R_plot_0 <- ggplot(data = out20201215_data, mapping = aes(x = time, y = R))
R_plot_1 <- R_plot_0 + layer(geom = "line", stat = "identity", position = "identity")
R_plot_1
R_plot_0 <- ggplot(data = out20201215_data, mapping = aes(x = time, y = R)) R_plot_1 <- R_plot_0 + layer(geom = "line", stat = "identity", position = "identity") R_plot_1
R_plot_0 <- ggplot(data = out20201215_data, mapping = aes(x = time, y = R))
R_plot_1 <- R_plot_0 + layer(geom = "line", stat = "identity", position = "identity")
R_plot_1

テスト投稿


PAGE TOP